
A naturally occurring compound, seasoning, natural preservative, and an essential nutrient required for blood pressure regulation, transportation of nutrients into and out of your cells, ion exchange, and brain-muscle communication. The idea that salt is bad for you and contributes to heart disease is an idea that has become more or less cemented as dogma in the West. Decades of scientific research have failed to show the benefits of a low-salt diet or connect it to heart disease, and in fact tend to show the opposite. Low-salt (DASH) diets are associated with higher cardiac risk across multiple studies. The primary original study responsible for the “sodium myth” did not control for fructose consumption, which is a major factor contributing to heart disease. All salts are not equal, in terms of their impact on your health. Read more HERE, HERE, HERE, Here, Here, Here and here
Aside from water, salt (sodium chloride) is the most ubiquitous food ingredient consumed by humankind. It is a nutrient that is essential to life and good health and has always been the predominant positive ion in extracellular body fluid for all multi-cellular animals.
Having originally evolved from a marine environment, the human body’s salt-to-water ratio is critical to metabolism. Human plasma contains 0.9 percent sodium chloride, most of it coming from food and a small amount from water. The fundamental indicator of salt intake sufficiency points to 1.5 teaspoons (8 grams) of salt per day as the basic human requirement.
SALT IS AN ESSENTIAL NUTRIENT
In clinical studies, salt is calculated in millimoles (mmol) of sodium, where 100 mmol of sodium amounts to 2300 mg which is contained in one teaspoon (5 grams) of salt.
If we do not consume sufficient sodium, our metabolism, driven by specific feedback mechanisms, goes into a sodium-sparing mode so that the circulatory system can maintain osmotic balance and adequate blood pressure. This has several important consequences for us. A reduced intake of sodium is characterized by the stimulation of the renin-angiotensin-aldosterone hormonal system (RAAS). Renin, the first enzyme taking part in the RAAS was clearly shown in a dose-response curve1 to increase as sodium intakes fell below 150 mmol sodium (or 1.5 teaspoons/8 grams of salt) per day. At a point of intake below 110 mmol (6 grams) sodium per day renin begins to rise rapidly. The RAAS feedback mechanism is the most transparent measure of our dose response to salt intake and is a fundamental indicator of sodium intake sufficiency.
Although this cascade of reactions is designed to sustain osmotic balance and blood pressure, chronically elevated levels of renin and aldosterone have significant negative effects on the condition of the circulatory system and may stimulate inflammatory agents within the body. Included among the negative outcomes of chronically elevated levels of renin and aldosterone are insulin resistance,2 metabolic syndrome,3 cardiovascular disease,4 cognition loss,5 and others.
SALT AND BLOOD PRESSURE
The overwhelming public interest in salt consumption derives from the concern over its perceived universal impact on blood pressure (BP). Unfortunately, this has long been a subject of significant myth-information. The cross-population blood pressure response to salt reduction is heterogeneous.6 With major reductions in salt (more than half of our current consumption), about 30 percent of the population will experience a slight drop (2-6 mm) in systolic BP, while about 20 percent will see a similar increase in BP, and the remaining 50 percent of the population will show no effect at all. Considering the relatively small impact of major salt reduction on blood pressure, it is unfortunate that consumers are not aware of all the other negative consequences that occur as a result of dietary salt reduction.
PUBLIC PRESSURE TO REDUCE SALT
In the late 1980s, in response to the notion that sodium had a major impact on a population’s blood pressure, an international study (Intersalt) was carried out to determine the impact of salt consumption on blood pressure.7 As it turned out, the per capita consumption of sodium in the majority of countries ranged between 130-210 mmol sodium or the equivalent of 1.3 to two teaspoons of salt (7-10 grams) per day. The results indicated that there was no clear pattern between the level of salt intake and blood pressure. However, there were four populations among the fifty-two groups that showed very low salt intakes and far lower than average blood pressures. The lowest consumption population in this group was the primitive Yanomami Indians, who live in the Brazilian rain forest. Normally, data points that are very far from the rest of the pattern are referred to as outliers and are generally omitted from the analysis. In this case, the outliers were included and a line drawn from them to the rest of the population in order to show that a pattern relating salt consumption to blood pressure did exist. (See Figure 1.)
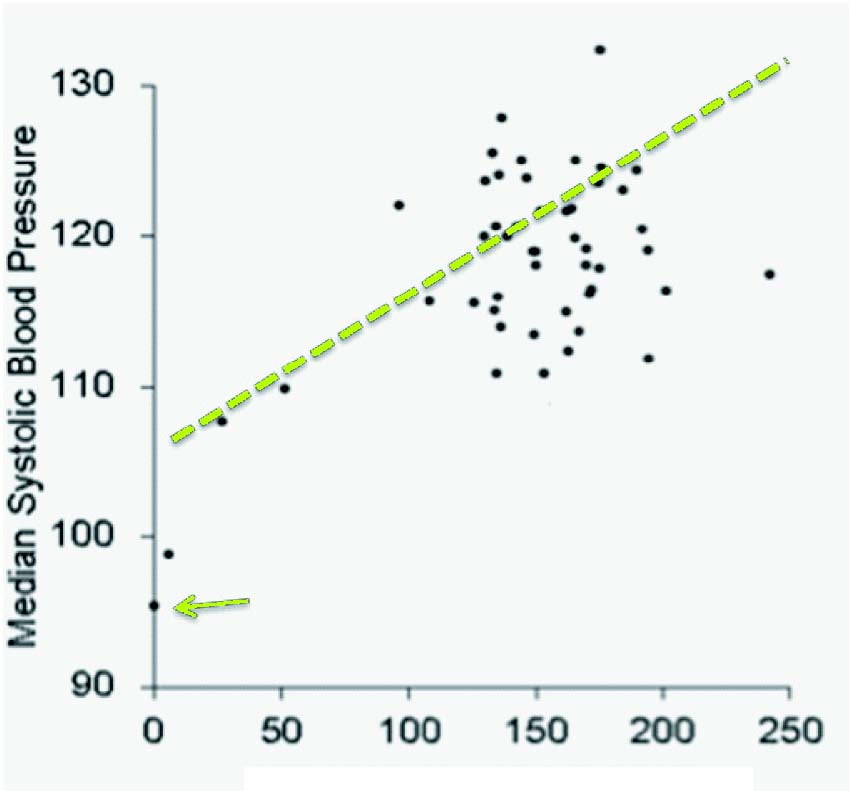
While the advisability of making comparisons between modern Western societies and those that have vastly different lifestyles, levels of physical activity, caloric intakes and environmental stresses is legitimately open to question, the issue of life-long low BP among the Yanomami was repeatedly used as a justification. The Yanomami are described in the ethnographic literature as an aggressive and violence-prone people. The stress associated with this character along with the continual exposure to environmental stresses does not appear to influence the BP of the Yanomami as they would other population groups. While their abnormal BP profile has been attributed to reduced salt consumption, a far more likely reason appears to be the almost complete absence of a D/D genotype—a genetic trait shared with other Amerindians such as the Xingu Indians of the Amazonian rainforest, one of the other four outlier points. Notwithstanding their lack of an age-related rise in blood pressure, the Yanomami are characterized as a small stature, high mortality and high fertility population with a low life expectancy. It is also interesting to note that despite their long history of evolution in a salt-limited rainforest environment, they have never acclimatized to low sodium intake and have chronically high levels of plasma renin. Nevertheless, the inclusion of the Yanomami data in the formal Intersalt analysis, however misguided, initiated the latest round of salt-restriction efforts.
The supposed merits of significant population-wide dietary salt reductions were further justified through the Rose population strategy theory,8 which contended that most risks to health, including hypertension, were evenly distributed as a continuum across the population rather than being confined to high-risk groups as shown in Figure 2.9
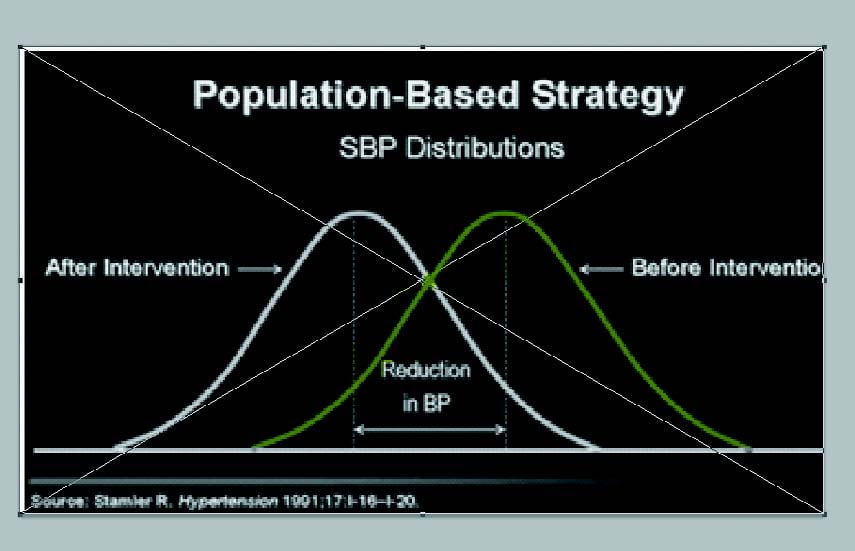
Accordingly, modest risk reductions in BP (such as those achievable through significant salt reduction) across the entire population, including normotensive individuals, might conceivably reduce the population incidence of cardiovascular disease. This inspired the idea that a great number of lives and millions of dollars in health care costs might be saved through dietary salt reduction. But this notion appears to have a number of obvious flaws.
In the first instance, salt sensitivity and the tendency towards elevated blood pressure is largely driven by genetics and thus not evenly distributed, but rather highly skewed across the population. In addition, if an intervention such as dietary salt reduction demonstrated even a small negative effect (such as any one of the outcomes resulting from stimulation of the renin-angiotensin- aldosterone system), this would tend to shift the risk curve in the opposite direction and result in greater risk of morbidity and mortality. Finally, any intervention that might statistically benefit the public health (such as an insignificant drop in BP) may not translate into any difference at all to an individual’s health—commonly referred to as the “Population Paradox.”10 Considering the apparent shortcomings to this theory, it is remarkable that it was so widely and uncritically accepted.
FLAWED STANDARDS
The intellectual stage was thus set to establish standards on salt consumption that were fundamentally flawed. And that’s exactly what happened with the Dietary Reference Intakes (DRI) for sodium. In fact, they sank a great deal further into the mire of medical myth-information. The DRI for sodium, the foundation publication for our current recommendations for salt consumption, clearly state at the outset that “Because of insufficient data from dose-response trials, an Estimated Average Requirement (EAR) could not be established, and thus a Recommended Dietary Allowance could not be derived. Hence, an Adequate Intake (AI) is provided.”11
This single statement concedes, from the very beginning, the shift away from an evidence-based approach in establishing recommendations to one of subjective inference: opinion. Rather than a plea for more research to enhance the insufficient base of evidence, the text presents a blunt fiat, based upon expediency rather than anything else. The AI was arbitrarily set by the DRI committee at 1,500 mg sodium or a little more than one half teaspoon (3 grams) of salt per day for young adults “…to ensure that the overall diet provides an adequate intake of other important nutrients and to cover sodium sweat losses in unacclimatized individuals who are exposed to high temperatures or who become physically active…” However, no supporting information on young adults was provided to confirm that this arbitrary figure was in any way justified. In fact, this opinion has since been shown to be incorrect.12
The case for setting the upper limit of salt consumption at the equivalent of 100 mmol (2,300 mg) sodium or one teaspoon (8 grams) of salt per day appeared even more problematic. Rather than determining the body’s integrated response to various levels of salt; i.e., the normal and rational dose response methodology used for all nutrients, it was clear from the start that the overwhelming preoccupation with just one surrogate measure for cardiovascular disease—blood pressure—would remain the singular focus: “The major adverse effect of increased sodium chloride intake is elevated blood pressure, which has been shown to be an etiologically related risk factor for cardiovascular and renal diseases.” Furthermore, the use of precisely 100 mmol sodium (contained in 5 grams or one teaspoon of salt) was not the result of any dose-response relationship involving an established suite of health outcomes. It was nothing more than an arbitrary and convenient set point from which to observe any reductions in blood pressure (regardless of how small) when sodium intakes were decreased.
Nevertheless, this was the intellectually bankrupt basis upon which the recommendations for salt were set, with full confidence that the public acceptance of salt-health mythology would serve to allay any critical scrutiny. What were these salt myths?
MYTH 1:
We eat more salt today than ever before.
FACT: Our current salt consumption (1.5 to 1.75 teaspoons per day, 8-9 grams) is about one half of the amount consumed between the War of 181213 and the end of World War II,14 which was about three to 3.3 teaspoons (16-17 grams) of salt per day.
MYTH 2:
Our knowledge of the major sources of salt in our diet (i.e., 80 percent from processed foods) is unquestionable.
FACT: These data, referred to in every medical publication, is based on a single paper from 1991, which involved a dietary recall (a very unreliable method of data gathering) of a total of just sixty-two persons.15
MYTH 3:
Our salt consumption continues to rise every year.
FACT: There has been no change in our consumption of salt since the mid-1950s.16
MYTH 4:
The thirty-year public health initiative in Finland represents a successful model of salt reduction.
FACT: While Finland was able to reduce salt consumption among its population from 2.3 teaspoons of salt (12 grams) per day down to 1.3 teaspoons (7 grams) per day in the period from 1970 to 2000 (in much the same way that the U.S. did from 1945-1960), the health benefits that they have achieved during the same time period were no better (and, in fact, marginally worse) than neighboring and other countries that did not reduce salt consumption.
MYTH 5:
Current levels of salt consumption result in premature cardiovascular disease and death.
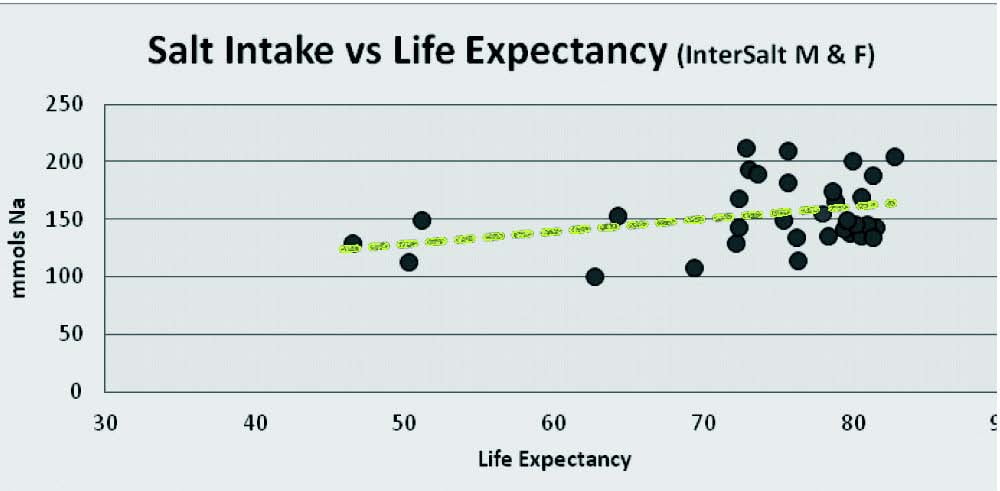
FACT: When average life expectancy in various countries is plotted against the average salt intake in those countries, it is clear that the higher the salt consumption, the longer the life expectancy. (See Figure 3.) While no cause-and-effect relationship between sodium intake and lifespan is implied, the data clearly demonstrate the compatibility between life expectancy and the associated levels of sodium intake.
FIGURE 3. InterSalt Life Expectancy
MYTH 6:
Cutting back on salt will improve the overall diet.
FACT: Salt makes the bitter phytochemicals in salad greens and vegetables more palatable. Removing salt from dressings or accompaniments will make these important diet items less acceptable and will discourage people from eating them.
MYTH 7:
Reduced salt levels are critical to the DASH diet.
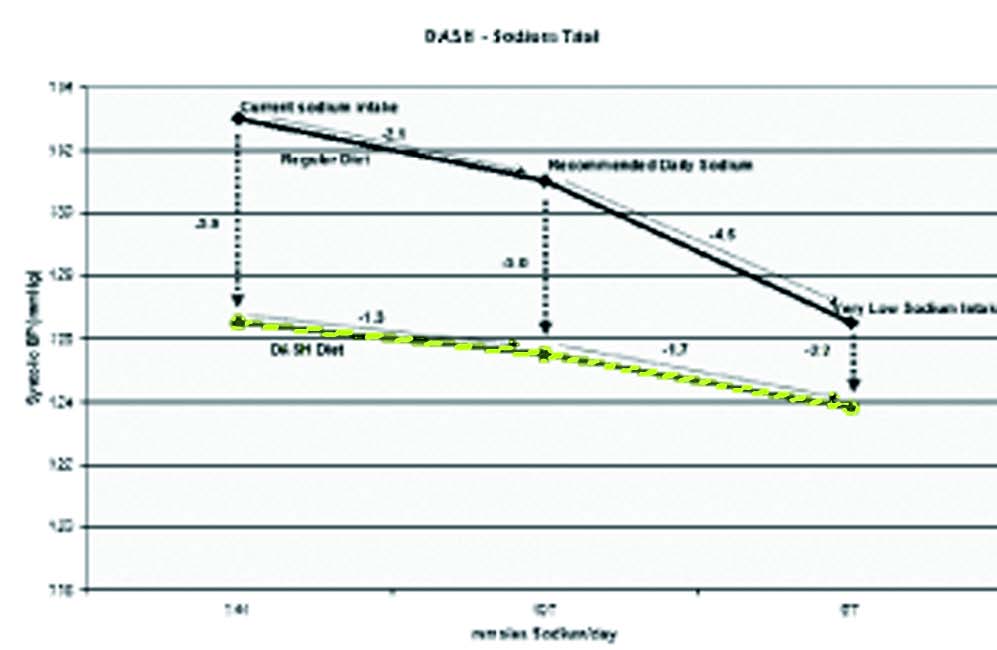
FACT: When the results of the DASH Sodium trial are examined (see diagram in Figure 4), it is immediately apparent that merely moving to a DASH diet (red line) has a significantly greater impact on blood pressure than simply lowering salt consumption. Dropping from the normal level of sodium consumption to the Dietary Guidelines’ recommended level reduced the systolic pressure in the American diet (blue line) by an average of 2.1 mm Hg. However, simply changing from a standard American diet to the DASH diet, without any changes to sodium consumption, reduced the systolic blood pressure by 5.9 mm Hg, almost three times the drop resulting from the recommended sodium reduction. More important, reducing salt makes the DASH diet far less palatable and thus discourages people from adopting it.
MYTH 8:
There is a clear relationship between salt intake and blood pressure.
FACT: The lack of a clear relationship between salt intake and blood pressure is best exemplified with the standard hospital saline IV drip, which supplies an average of three liters of 0.9 percent sodium chloride per day. This is equivalent to twenty-seven grams of salt (4.5 teaspoons) per day while in the hospital in addition to the six grams (one teaspoon) of salt taken in food (if the Guidelines are followed). That is a total of thirty-three grams of salt per day or more than five times the Dietary Guideline recommendations! Yet patients’ BP is checked every four to six hours and does not change. Where is the purported relationship of salt intake to blood pressure?
MYTH 9:
Reducing salt intake can do no harm.
FACT: Reduced salt intakes have repeatedly been linked in the medical literature to the following conditions:
• Insulin resistance (diabetes)
• Metabolic syndrome
• Increased cardiovascular mortality and readmissions
• Cognition loss in neonates and older adults
• Unsteadiness, falls, fractures
• Lifelong avidity for salt
• And more
MYTH 10:
The U.S. Dietary Guidelines process is valid.
FACT: The original Dietary Recommended Intakes (DRI), issued under the imprimatur of the Institute of Medicine (IOM) (National Academy of Sciences), were immediately accepted internationally and spared the critical scientific review normally given to nutritional recommendations. Indeed, any conscientious perusal of the document reveals the numerous compromises and rationalizations made in lieu of actual evidence in order to arrive at the final recommendations. This was reiterated during a 2007 IOM workshop entitled, “The Development of DRIs 1994–2004: Lessons Learned and New Challenges,”17 where several participants stressed that the DRIs were largely based on the lowest quality of information—opinion—rather than on randomized controlled clinical trials which represent the highest quality of evidence. Yet the disposition of the DRIs provides an insight into how far we have strayed from the scientific principle of adherence objectivity and evidence-based medicine.
The five-year Dietary Guidelines for Americans (DGA) review process has always been publicized as being an “independent and objective” reevaluation of the previous DGAs. The 2005 DGA for sodium referred to the DRIs as a foundation document and assumed all its recommendations. The consequent 2010 DGAs reconfirmed the recommendations of the 2005 DGAs with the proviso that the at-risk populations consume 1,500 mg sodium (1/2 teaspoon/3 grams salt) per day for the upper limit. As it happened, the Chair of the original DRIs committee that set the first recommendations for sodium also happened to serve as the Chair of the 2005 Dietary Guidelines Subcommittee on Electrolytes and thus evaluated the very recommendations that he was responsible for promulgating in the first place.
In 2010, the process was repeated and, once again, the same Chair of the Subcommittee on Electrolytes ran the show. This sequence, fully sanctioned by the Institute of Medicine and the U.S. Department of Agriculture, begs the question as to whether any “independent and objective” analytical process can feature a single individual piloting the creation of standards (DRIs) who then is charged with evaluating his own recommendations five years later, and asked once again to evaluate his prior evaluations. This process makes a sham of the concept of independent, objective evaluations and makes a mockery of the integrity of our great scientific institutions!
WHERE ARE WE NOW?
Notwithstanding the myths and limitations described above, the recommendations for sodium have been accepted, without reservation, by virtually every public health agency around the world. Yet, despite the near impossibility of goal achievement in practical terms, the recommendations appear to represent a level of consumption that results in no more than mid-single digit reductions in systolic BP for a limited portion of the population and a similar sized increase in BP for another limited portion of the population. Several meta-analyses have seriously questioned the purported long-term benefits of population-wide salt reduction,18-21 while others have vigorously supported it.22
In fact, conflicting comment and repeated parsing of the “evidence” has become a regular feature of the salt-and-health debate, leading some journalists to complain that “almost every nutritional ‘fact’ is in reality an opinion, often based on poor quality evidence.”23 Considering that overall good health comprises considerably more than a single digit blood pressure response, the current dietary recommendations have served as a decades-long red herring obscuring the need for more research to get more and better dose-response data.
A BETTER UNDERSTANDING OF SALT NEEDS
Several recent publications appear to get us closer to what may be considered to be the human requirement for salt. For example, a very recent study from Harvard Medical School demonstrated that when healthy people were placed on a very low-salt diet (20 mmol sodium or a fifth of a teaspoon (1 gram) of salt per day), they developed insulin resistance within seven days.24 Those placed on high salt diets (150 mmols or 1.5 teaspoons/8 grams of salt) showed no such effect. We conclude that low-salt intakes warrant further investigation in the pathogenesis of diabetes and cardiovascular disease.
In a series of three analyses of consecutive National Health and Nutrition Examination Surveys (NHANES I,25 II ,26 and III27 ), researchers were unable to demonstrate any survival advantage resulting from low-sodium diets; on the contrary, a modest relationship between increased all-cause mortality and low-sodium diets was observed (although non-significant).
A recent study conducted to examine the health outcomes related to salt intake (as measured by twenty-four-hour urinary sodium), demonstrated that lower sodium excretion was associated with an increased risk of cardiovascular death, while higher sodium excretion did not correspond with increased risk of hypertension or cardiovascular disease complications.28 Another meta-analysis of one hundred sixty-seven studies by Graudal and co-workers29 confirmed and expanded upon previous reports that significant dietary sodium restriction from greater than or equal to 150 mmol sodium (1.5 teaspoons/8 grams of salt) per day down to a level of less than or equal to 120 mmol sodium (1.2 teaspoons/6 grams of salt) per day resulted in limited but significant reductions in blood pressure. In white subjects who were hypertensive, the mean reduction was 5.5 mm Hg systolic and 2.8 mm Hg diastolic. For white normotensive subjects these figures dropped down to 1.3 mm Hg systolic and 0.1 mm Hg diastolic. However, the meta-analysis went further to confirm and quantified the unfavorable impacts that sodium restriction had on several other risk factors for cardiovascular disease. These included significant increases in renin, aldosterone, catecholamines (adrenaline, noradrenalin) and lipids (cholesterol and triglycerides). Renin and aldosterone were of particular concern as they have been repeatedly associated with increases in cardiovascular mortality in long-term follow-up studies.
During his Presidential address to the International Society of Hypertension, Alderman referred to a J-shaped response to describe the broader impact of sodium intake on health outcomes, referring to evidence of harm observed at the low and high extremes of consumption, with the least impact noted in a broad middle range centered around 3,500 mg sodium or 1.5 teaspoons/8 grams of salt per day.30
In a recent study, published in the Journal of the American Medical Association (JAMA),31 researchers found moderate salt intake to be associated with the lowest risk of cardiovascular events, whereas low intakes, equivalent to less than or equal to 3,000 mg sodium or 1.5 teaspoons (8 grams) of salt per day, were associated with an increased risk of cardiovascular death and hospitalization for congestive heart failure, and higher intakes of more than 7,000 mg sodium or three teaspoons (15 grams) of salt per day, were associated with an increased risk of stroke, heart attack and other cardiovascular events. Once again, a J-shaped curve appeared to describe the dose-response relationship.
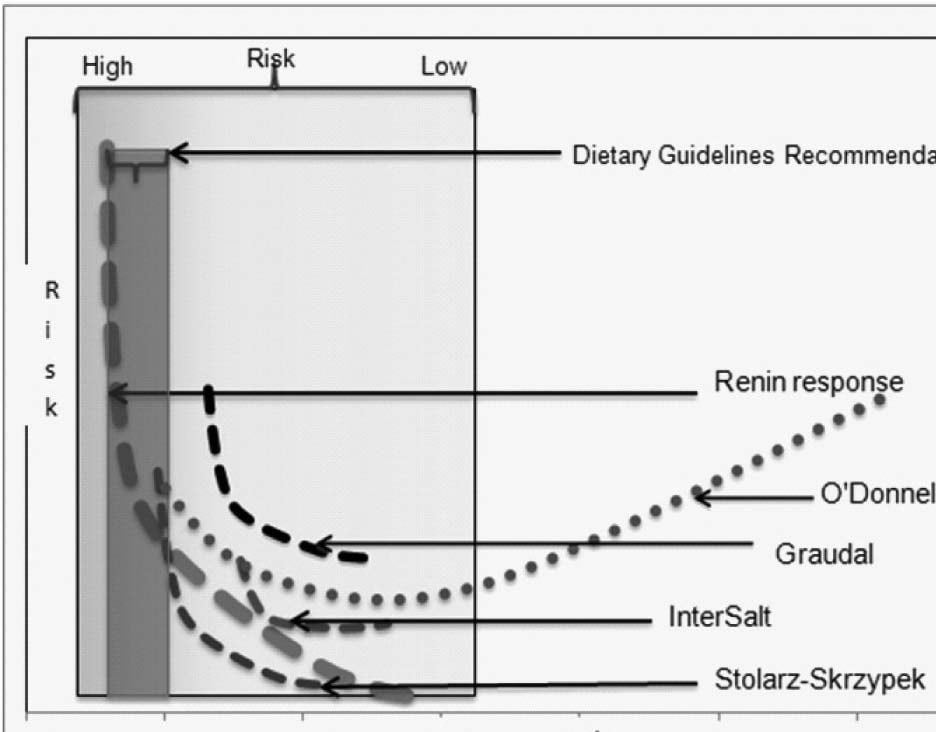
FIGURE 5. Consolidated Study Results
The J-shaped or U-shaped curve is a common dose-response occurrence for essential nutrients in both plant and animal species.32 French nutritionist, Gabriel Bertrand, mathematically described the original relationship in 1912.33 What is now known as Bertrand’s Rule applies to a great many micro- and macronutrients. At very low levels of intake, where there is insufficient nutrient flux to support the full range of associated physiological functions, there is a high risk of adverse effects. This is considered the deficiency range. If the adverse effects don’t result in acute catastrophic events, individuals may survive, although at a diminished potential. As the level of nutrient is increased to a point where the deficiency disappears, minimal adverse effects are experienced and homeostasis is established. Continually increasing intake leads to exceeding the homeostasis requirement and adverse effects reappear (though not necessarily the same ones).
Although there is a quantity of data describing storage of sodium within the body, it is difficult at this stage to speculate what role storage plays in maintaining physiological homeostasis. It therefore remains for us to determine what type of data are available to give us an indication of the optimum level of consumption. Simply from a biological feedback perspective, the point at which a deficiency of salt elicits an increase in renin production must be considered a basic biological indicator. Using the study of Alderman, et al.,1 anything less than 170 mmol (3,910 mg) sodium per day (1.7 teaspoons/9 grams salt) appears as a starting point. As increases in renin only occur when sodium intake is insufficient, these data do not permit an estimate for an upper limit.
SALT CONSUMPTION AND LIFE EXPECTANCY
Average life expectancy is often considered a measure of the overall health of a population, (although infant mortality in some countries can be a confounding factor). Comparing the InterSalt study data on average sodium consumption in thirty-two countries around the world34 with life expectancy results in the following picture. If we take the top 20 percent with greatest life expectancy, their sodium intake ranges from 140–205 mmol per day, averaging around 170 mmol (1.75 teaspoons of salt/9 grams). While no cause-and-effect relationship between sodium intake and lifespan is implied, the data do demonstrate the compatibility between life expectancy and the associated levels of sodium intake.
While not providing a continual dose-response relationship, the data in the recent Graudal paper29 illustrate a series of responses to reducing salt consumption from more than 150 mmol (1.5 teaspoons/8 grams of salt) down to less than 120 mmol sodium (1.2 teaspoons/6 grams) per day. Together with a small but significant reduction in blood pressure, there is also a concomitant significant increase in several other risk factors for diabetes and cardiovascular disease. Again, while no continual dose response relationship is implied, the risks appear to outweigh the benefits when reducing sodium consumption below 3,450 mg (1.5 teaspoons/8 grams) per day.
Consistent with the NHANES studies,25-27 the paper demonstrated significant increases in cardiovascular mortality as consumption of sodium dropped from a high of 260 mmols (just over 2.5 teaspoons/13 grams of salt) down to a low of 107 mmols (a bit more than one teaspoon).
Finally, based on a long-term study with a large cohort, the O’Donnell paper31 sets out a J-shaped response curve with the range of lowest risk between a daily consumption of 1.3 (7 grams) and three teaspoons (15 grams) of salt per day.
If the data from the above studies are compiled, it is apparent that the range of sodium intake at which there is least negative health outcome impact is anywhere above approximately 3,000 mg per day or the equivalent of 1.3 teaspoons (7 grams) of salt. This also happens to be the range that most people around the world consume. These data are not based on surrogate end points, but on hard outcomes (mortality) and dose responses involving measurable feedback responses (renin, aldosterone, catecholamines, cholesterol and triglycerides) that, in the words of the DRIs, are not subject to “imprecision in blood pressure measurement.”
These results support the idea that sodium is consumed in a fairly narrow hygienic range,35 which has more recently been approximated as 2,691-4,876 mg sodium or between 1.2 (6 grams) and 2.13 teaspoons (11 grams) of salt per day.36
Considering the available evidence, it is difficult to determine a practical maximum for salt because the data suggest that such a level is outside our current consumption range; i.e., greater than 7,000 mg sodium or the equivalent of three teaspoons (15 grams) of salt per day. In other words, our taste response to salt may be self-limiting.
HISTORICAL RATES OF SALT CONSUMPTION
It is of great interest that available data suggest Western societies consumed between three and 3.3 teaspoons (15-17 grams) of salt per day from the early 1800s until the end of World War II, based on military archives for prisoner-of-war and soldier rations around the world. During the Anglo-American War of 1812, despite its high cost, salt rations amounted to three teaspoons (15 grams) per day.37 American prisoners of war, incarcerated in Britain’s Dartmoor prison, bitterly complained that the 1.5 teaspoons (8 grams) of salt per day they received was part of “…scanty and meager diet for men brought up in the land of liberty, and ever used to feast on the luscious fruits of plenty…”38 Declassified World War II documents regarding rations fed to American prisoners of war show a ration of one hundred forty grams per week or 3.3 teaspoons (17 grams) per day.39
After World War II, when refrigeration began to displace salt as the main means of food preservation, salt consumption in the U.S. (and somewhat later in other countries) dropped dramatically to about half that rate, or nine grams (1.8 teaspoons) per day and, based on twenty-four hour urinary sodium data, has remained flat for the last fifty years.40 During that time, rates of hypertension have increased,41 thus casting doubt on any linkage between the two.
It is telling that this sudden drop took place without pressure or influence from any government Dietary Guidelines, public health institutions or strident warnings from salt-reduction advocates. The massive reduction was the result of an effortless shift to a palatable, cold-chain-based food supply. It is further interesting that this abrupt drop halted at one level of consumption fifty years ago and descended no further. It is equally extraordinary that, without guidance or pressure of any kind, the consumption of salt around the world, for more than two centuries has remained in the range of 1.5 to three teaspoons (8-15 grams) per day, which, from all the available data, appears to hold the lowest risk for us. It lends support to the notion of the “wisdom of the body” at work through a mechanism that may not be as obvious as the typical sodium appetite so common in most other mammalian species, but effective nevertheless.
Regardless of the evidence, we now must face a certain reality resulting from the two decades-long campaign to reduce salt. Because the Dietary Reference Intakes for salt were promulgated by the Institute of Medicine, they were immediately adopted without question by most public health agencies around the world. This position, repeated and amplified by an uncritical press influenced the food industry to consider salt reduction strategies very seriously, not because there was genuine concern for the impact of salt on health, but for two commercial considerations. The first was the concern related to public pressure as the food industry did not want to be perceived as purveyors of unhealthy products. Second, reduced salt product formulations had the potential to become new “low salt” varieties that might capture additional market share.
Salt reduction initiatives are now the largest product development expenditure in the processed food industry, and the chemical senses research institutes—which played a critical role in promoting salt reduction strategies42—are the major recipients of these research funds. Advancements in chemistry may result in reduced-sodium products that have acceptable taste profiles for consumers. If this does occur, the question remains how a reduced-salt food supply might impact the health of the public.
Early indications from the UK indicate that while the salt content of processed foods is reduced, the sales of table salt appear to have increased dramatically.43 Unfortunately, this phenomenon is complicated by the habit of using table salt for de-icing home steps and sidewalks in the UK. As yet, no solid relationship has been established between reduced salt in processed food formulations and increased use of table salt. The results of the Food Standards Agency (FSA) UK salt survey are due in 2012 and it may be possible to determine whether urinary sodium levels have indeed fallen. The 2011 FSA salt survey results coming out of Scotland44 indicate that this had not occurred as yet, and consumers do appear to be making up for the significantly reduced salt levels in processed foods through some means.
If this is indeed the case, a question to consider is whether our relatively stable consumption of salt around the world is the result of our avidity for the taste of salt or a physiological sodium appetite mechanism that drives us to seek out a particular level of salt. This is a critical question. If advances in salt reduction chemistry are able to trick our taste senses and there are no other physiological mechanisms at work, then consumers will be able to reduce their salt consumption, perhaps even as far down as to the DGA recommended levels of 1,500–2,300 mg sodium (a little more than one-half to one teaspoon/3-5 grams of salt) per day. If that were to be the case, then the reported population-wide risks associated with increased plasma renin and aldosterone, catecholamines, cholesterol and triglycerides would be of concern and people may die prematurely as a result.
If, on the other hand, there is some form of sodium appetite mechanism at work, then the chemistry directed at deceiving our taste senses should not be particularly effective, since our hunger for salt would result from something other than organoleptic pleasure. If this were the case, then there is a possibility that reducing salt in processed foods may stimulate increased consumption of food, simply to achieve a set level of sodium intake, thereby exacerbating the obesity epidemic. (The sodium appetite mechanism is currently applied commercially to cattle finishing feed, where total intake is controlled by adjusting the level of salt content. Reducing the salt content stimulates cattle to consume more feed, while increasing salt has the opposite effect.)
Aside from the previous risks noted, there is a possibility that reduced salt in processed food formulations will affect dietary choices. The nutritious phytonutrients associated with dark green vegetables and salads are bitter and generally more palatable with salt added directly, through dressings or in processed accompaniments. The heart-healthy diet practiced around the Mediterranean Basin is considerably higher in salt than that in most Western European and North American countries, because so many of the traditional foods they consume are still preserved with salt. However, salads and vegetables make up a large part of that diet and salt is used liberally to ensure palatability. (The Latin derivation of the word “salad” is “sal,” and refers to salted vegetables.) A reduced dietary salt intake may discourage consumption of salads and vegetables, particularly among children.45 In the UK, where salt has been removed from many school lunches, students avoid their vegetables until they get home. Writing in the UK Telegraph, journalist Paul Eastham complained that since the school ban on salt shakers, his daughter stopped eating vegetables, because they are so bland.
“All the goodness they promise to deliver remains untouched on the plate—a complete waste of nutrients, health potential and money—all because they remain unpalatable…. My daughter might not touch the ‘bland’ vegetables at school, but at home—where she is allowed to use salt—she clears her plate.”46
We appear to be at a crossroads in the salt-health debate. The decades-long impasse regarding the merits of population-wide salt reduction can only be resolved with conclusive research—not to delay the implementation of public health policies but to substantiate them before they are imposed on the public. The study that would best serve the needs of consumers and public health agencies alike would be a large-scale, long-term, randomized, controlled trial on the impact of reduced salt intakes on a suite of agreed health outcomes—not surrogate measures. Considering the food industry’s current focus and expenditures on salt reduction efforts, it is in its interest to financially support such a trial, if only to confirm the importance of their ongoing salt reduction efforts.
REFERENCES
- Alderman MH, Madhavan S, Ooi WL, Cohen H, Sealey JE, Laragh JH. Association of the renin-sodium profile with the risk of myocardial infarction in patients with hypertension. N Engl J Med. 1991;324:1098–1104.
- Garg R, Williams GH, Hurwitz S, Brown NJ, Hopkins PN, Adler GK. Low-salt diet increases insulin resistance in healthy subjects. Metabolism – Clinical and Experimental. 2011;60(7):965-968.
- Nakandakare E, Charf A, Santos F, et al. Dietary salt restriction increases plasma lipoprotein and inflammatory marker concentrations in hypertensive patients. Atherosclerosis. 2008;200:410–6.
- Stolarz-Skrzypek K, Kuznwtsova T, Thijs L, et al. Fatal and nonfatal outcomes, incidence of hypertension, and BP changes in relation to urinary sodium excretion. JAMA. 2011;305:1777-1785.
- Renneboog B, Musch W, Vandemergel X, Manto MU, Decaux G. Mild chronic hyponatremia is associated with falls, unsteadiness, and attention deficits. Am J Med. 2006;119(1):71.e1-8.
- Miller JZ, Weinberger MH, Daugherty SA, Fineberg, NS, Christian JC, Grim CE. Heterogeneity of blood pressure response to dietary sodium restriction in normotensive adults. J Chron Dis. 1987:40(3):245-250.
- Intersalt Cooperative Research Group. Intersalt: an international study of electrolyte excretion and blood pressure. Results for 24 hour urinary sodium and potassium excretion. BMJ. 1988;297(6644):319-328.
- Rose G. Sick Individuals and Sick Populations. International Journal of Epidemiology. 1985;14(1):32-38.
- Stamler R. Implications of the INTERSALT study. Hypertension. 1991;17(Suppl 1):I16–I20.
- Chariton BG. A critique of Geoffrey Rose’s “population strategy” for preventive medicine. J R Soc Med. 1996;88:607-610.
- National Research Council. Dietary Reference Intakes for Water, Potassium, Sodium, Chloride, and Sulfate.: The National Academies Press, Washington, DC. 2005:p. 270.
- Maillot M, Drewnowski A. A Conflict between Nutritionally Adequate Diets and Meeting the 2010 Dietary Guidelines for Sodium. Am J Prev Med. 2012;42(2):174-179.
- Rations: The History of Rations, Conference Notes, Prepared by The Quartermaster School for the Quartermaster General, January 1949, accessed at http://www.qmfound.com/history_of_rations.htm on 12/20/2011.
- American Prisoners Of War In Germany, Prepared by Military Intelligence Service War Department, November 1945, Restricted Classification Removed-STALAG 17B (Air Force Non-Commissioned Officers) accessed at http://www.valerosos.com/AMERICANPRISONERSOFWAR.pdf on 12/20/2011.
- Mattes RD, Donnelly D. Relative contributions of dietary sodium source. J Am Coll Nut. 1991;10(4):383-93.
- Bernstein AM, Willett WC. Trends in 24-h urinary sodium excretion in the United States, 1957-2003: a systematic review. Am J Clin Nutr. 2010 Nov;92(5):1172-80. Epub 2010 Sep 8.
- Food and Nutrition Board, Institute of Medicine, “The Development of DRIs 1994-2004: Lessons Learned and New Challenges. Workshop Summary,” accessed at: http://www.iom.edu/Reports/2007/The-Development-of-DRIs-1994-2004-Lessons-Learned-and-New-Challenges-Workshop-Summary.aspx on 1/12/2012.
- Hooper L, Bartlett C, Davey SG, et al. Advice to reduce dietary salt for prevention of cardiovascular disease. Cochrane Database Syst Rev. 2004;(1):CD003656.
- Jurgens G, Graudal NA. Effects of low sodium diet versus high sodium diet on blood pressure, renin, aldosterone, catecholamines, cholesterols, and triglycerides. Cochrane Database Syst Rev 2004; (1):CD004022.
- Assessment of Non-drug Treatment Strategies in Patients with Essential Hypertension: Reduction in Salt Intake (Nutzenbewertung Nichtmedikament? Ser Behandlungsstrategien Bei Patienten Mit Essenzieller Hypertonie: Kochsalzreduktion). Institute for Quality and Efficiency in Health Care. Executive Summary of Report A05-21B, 2009. Benefit Cologne, Germany: Executive Summary of Meta-analysis in English.
- Taylor RS, Ashton KE, Moxham T, Hooper L, Ebrahim S. Reduced Dietary Salt for the Prevention of Cardiovascular Disease: A Meta-Analysis of Randomized Controlled Trials [Cochrane Review]. Am J Hyperten. 2011;24(8):843–853.
- He FJ, MacGregor GA. Effect of longer-term modest salt reduction on blood pressure. Cochrane Database of Systematic Reviews. 2004, Issue 3. Art. No.: CD004937.
- Hawkes N. Take dietary truths with a pinch of salt. BMJ. 2011;343:d5346.
- Garg R., Williams GH, Hurwitz S, Brown NJ, Hopkins PN, Adler GK. Low-Salt Diet Increases Insulin Resistance in Healthy Subjects, Metabolism. 2010;60(7):965-68. Epub 2010 Oct 30.
- Alderman MH, Cohen H, Madhavan S. Dietary sodium intake and mortality: the National Health and Nutrition Examination Survey (NHANES I). Lancet. 1998;351(9105):781-5
- Cohen HW, Hailpern SM, Fang J, Alderman MH, Sodium intake and mortality in the NHANES II follow-up study. Am J Med. 2006;119(3):275.e7-14.
- Cohen HW, Hailpern SM, Alderman MH, Sodium intake and mortality follow-up in the Third National Health and Nutrition Examination Survey (NHANES III). J Gen Intern Med. 2008;23(9):1297-302. Epub 2008 May 9.
- Ibid.
- Graudal NA, Hubeck-Graudal T, Jürgens G. Effects of low-sodium diet vs. high-sodium diet on blood pressure, renin, aldosterone, catecholamines, cholesterol, and triglyceride (Cochrane Review). Am J Hypertens 2011;25:1–15.
- Alderman M. Dietary Sodium and cardiovascular disease: the ‘J’-shaped relation. J Hypertens. 2007:25;903-907.
- O’Donnell MJ, Yusuf S, Mente A, Gao P, Mann JF, Teo K, McQueen M, Sleight P, Sharma AM, Dans A, Probstfield J, Schmieder RE. Urinary sodium and potassium excretion and risk of cardiovascular events. JAMA. 2011 Nov 23; 306(20):2229-38.
- Mertz W, The essential trace elements. Science. 1981:213:580–583.
- Bertrand G. On the role of trace substances in agriculture. Eighth Int. Congr, Appl. Chem. 1912;28:30-40 .
- INTERSALT Cooperative Research Group: INTERSALT:An international study of electrolyte excretion and blood pressure. Results for 24-hour urinary sodium and potassium excretion. Br Med J. 1988;297:319-330.
- Folkow B. Salt and Hypertension. News in Physiological Sci. 1990;5;220-224.
- McCarron DA, Geerling JC, Kazaks AG, Stern JS. Can Dietary sodium intake be modified by public policy? Clin J Am Soc Nephrol. 2009;4:1878-1882.
- Rations: The History of Rations, Conference Notes, Prepared by The Quartermaster School for the Quartermaster General, January 1949, accessed at http://www.qmfound.com/history_of_rations.htm on 12/20/2011.
- James Adams, Dartmoor Prison, A Faithful Narrative of the Massacre of American Seamen, to Which is added a Sketch of the Treatment of Prisoners During the Late War by the British Government (Pittsburgh, S. Engles, 1816), accessed at http://www.archive.org/stream/prisonersmem00andr#page/12/mode/2up/search/salt on 12/20/2011.
- American Prisoners of War in Germany, Prepared by Military Intelligence Service War Department, November 1945, Restricted Classification Removed – STALAG 17B (Air Force Non-Commissioned Officers) accessed at http://www.valerosos.com/AMERICANPRISONERSOFWAR.pdf on 12/20/2011.
- Bernstein AM, Willett WC. Trends in 24-h urinary sodium excretion in the United States, 1957-2003: a systematic review. Am J Clin Nutr. 2010;92(5):1172-1180. Epub 2010 Sep 8.
- Ayala C, Croft JB, Wattigney WA, Mensah GA. Trends in Hypertension-Related Death in the United States: 1980- 1998. J Clin Hypertens. 2004;6(12):675-681.
- Institute of Medicine. Strategies to reduce sodium intake in the United States. Washington, DC: National Academies Press; 2010.
- Watson E. FSA: Salt sales might be up, but consumption is down. Food Manufacture.CO.UK. 18 June 2010. Accessed at http://www.foodmanufacture.co.uk/Sectors/Healthyfoods/FSA-Salt-sales-might-be-up-but-consumption-is-down on 1/11/2012.
- Scottish Centre for Social Research. A survey of 24 hour urinary sodium excretion in a representative sample of the Scottish population as a measure of salt intake. April 2011. Accessed at http://www.foodbase.org.uk//admintools/reportdocuments/681-1-1229_S14047.pdf on 1/11/2012.
- Balitsis JK. Impact Of Sodium Chloride On Liking Of Cruciferous Vegetables. 2008, Master of Science Thesis, Ohio State University, Columbus, OH.
- Paul Eastham, “Take this ban with a pinch of salt,” London Telegraph, Nov., 13 2006, accessed at http://www.telegraph.co.uk/health/main.jhtml?view=DETAILS&grid=&xml=/health/2006/11/13/hsalt13.xml, on Dec.6, 2007.
Source: https://www.westonaprice.org/health-topics/abcs-of-nutrition/salt-and-our-health/